Profiling and Performance
Profiling is an essential procedure to ensure that you are utilising the given architecture with a given algorithm. Sometimes, we might think we are doing efficient computation. However, this will not always be the case unless we do the proper profiling and check if all the resources are utilized properly.
Using Nvidia HPC SDK, we could profile our OpenACC code. We could do the profiling using the Command line or the GUI.
Command Line
export NVCOMPILER_ACC_TIME=[]- [1]: kernel launches
- [2]: data transfers
- [4]: region entry/exit
- [8]: wait for operations or synchronizations
- [16]: device memory allocates and deallocates
Setting export NVCOMPILER_ACC_NOTIFY=3 provides kernel executions and data transfer information.
Profiling: Compilation
// compilation
Vector_Addition:
     12, Generating NVIDIA GPU code
     14, #pragma acc loop gang, vector(128) /* blockIdx.x threadIdx.x */
     12, Generating implicit copyin(a[:n]) [if not already present]
         Generating implicit copyout(c[:n]) [if not already present]
         Generating implicit copyin(b[:n]) [if not already present]

//execution
[u100@mel2041 Unified-memory]$ ./a.out
This program does the addition of two vectors
upload CUDA data  file=/Vector-addition-openacc.c function=Vector_Addition line=12 device=0 threadid=1 variable=b bytes=400
upload CUDA data  file=/Vector-addition-openacc.c function=Vector_Addition line=12 device=0 threadid=1 variable=a bytes=400
launch CUDA kernel  file=/Vector-addition-openacc.c function=Vector_Addition line=12 device=0 threadid=1 num_gangs=1 num_workers=1 vector_length=128 grid=1 block=128
download CUDA data  file=/Vector-addition-openacc.c function=Vector_Addition line=17 device=0 threadid=1 variable=c bytes=400
PASSED
GUI
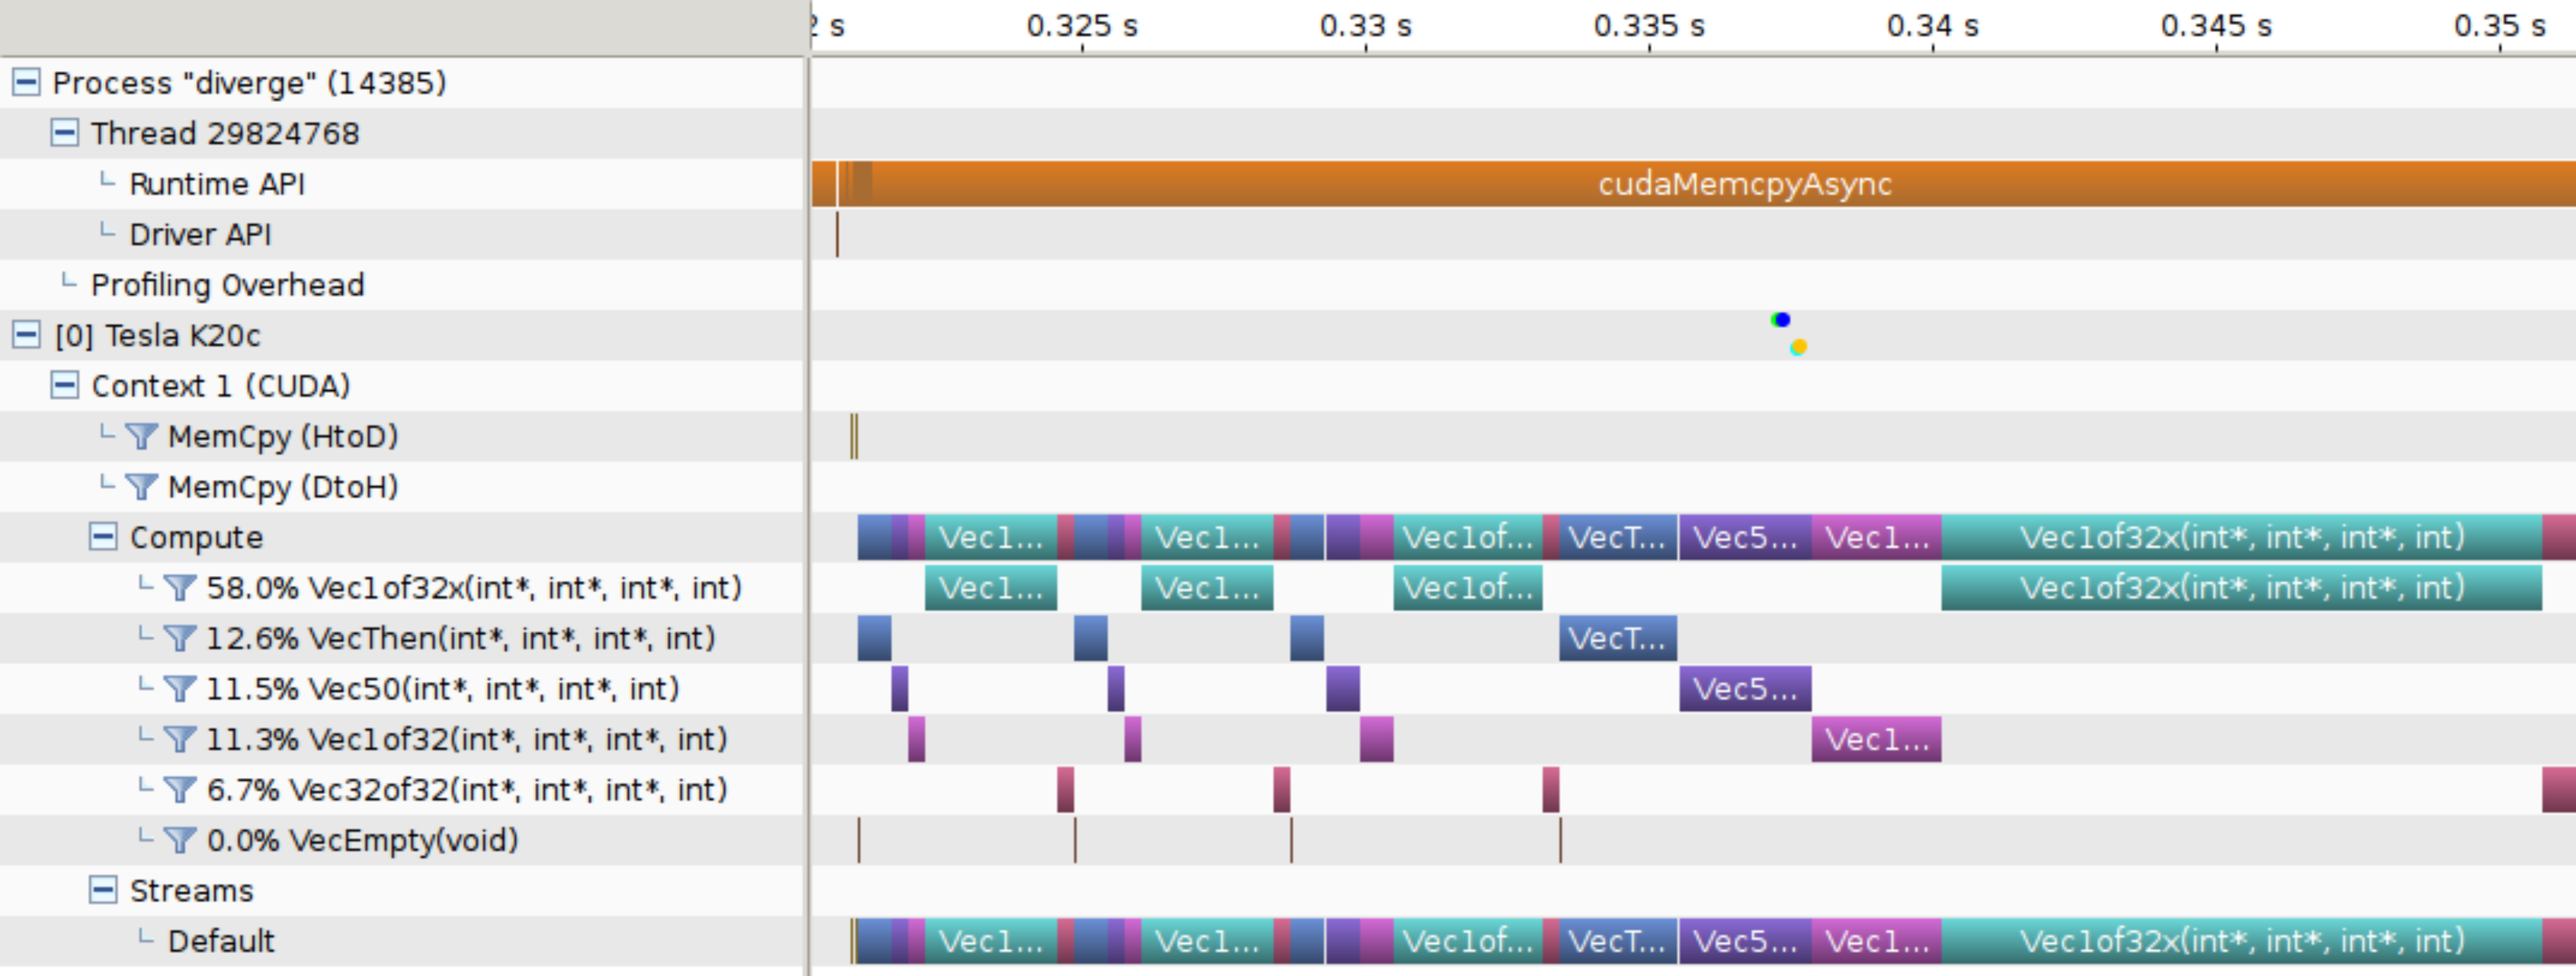
The Visual Profiler is organized into views. Together, the views allow you to analyze and visualize the performance of your application. The Timeline View shows CPU and GPU activity that occurred while your application was being profiled. Multiple timelines can be opened in the Visual Profiler simultaneously in different tabs. The following figure shows a Timeline View for an OpenACC application.
In order to visualize the performance of your application, you should connect to the HPC machine via -X forward; otherwise, you will not be able to see the GUI application. For example, on MeluXina, you should do the following.
GUI login
We also need to add a few extra modules to open a GUI application. On MeluXina, we need to add the following modules:
Required modules
Once the required modules are loaded, you can compile your application and visualize its performance. Finally, we need to use the command line nsys-ui to open the GUI application and load timeline.nsys-rep.
Compilation and GUI
```
[u100@mel2073 Vector-addition]$ nvc -fast -acc=gpu -gpu=cc80 -Minfo=accel Vector-addition.c
nvc-Warning-CUDA_HOME has been deprecated. Please use NVHPC_CUDA_HOME instead.
[u100@mel2073 Vector-addition]$ nsys profile -o timeline ./a.out
Warning: LBR backtrace method is not supported on this platform. DWARF backtrace method will be used.
This program does the addition of two vectors
Please specify the vector size = 10000
PASSED
Generating '/tmp/nsys-report-6c02.qdstrm'
[1/1] [========================100%] timeline.nsys-rep

// Open the GUI application  and load timeline.nsys-rep
$ nsys-ui &
```