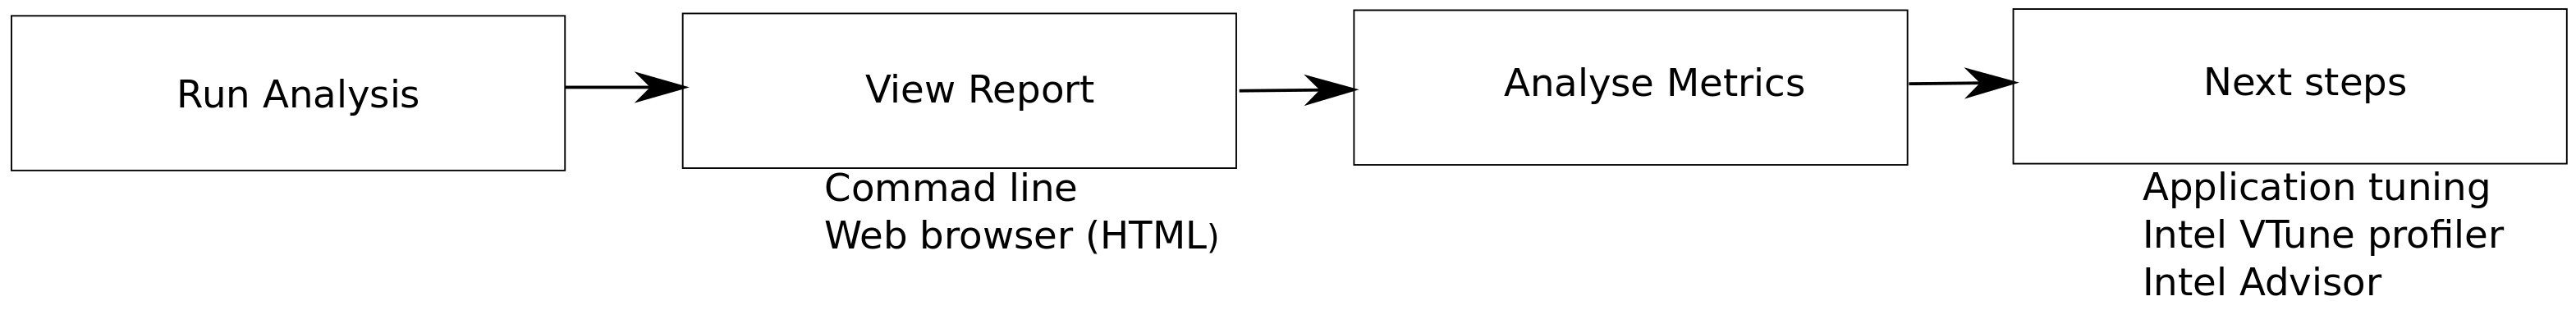
Profiling and Performance
Profiling is an important task to be considered when a computer code is written. Writing parallel code is less challenging, but making it more efficient on a given parallel architecture is challenging. Moreover, from the programming and programmer’s perspective, we want to know where the code spends most of its time. In particular, we would like to know if the code (given algorithm) is compute bound, memory bound, cache misses, memory leak, proper vectorisation, cache misses, register spilling, or hot spot (time-consuming part in the code). Plenty of tools are available to profile a scientific code (computer code for doing arithmetic computing using processors). However, we will focus on a few of the widely used tools.
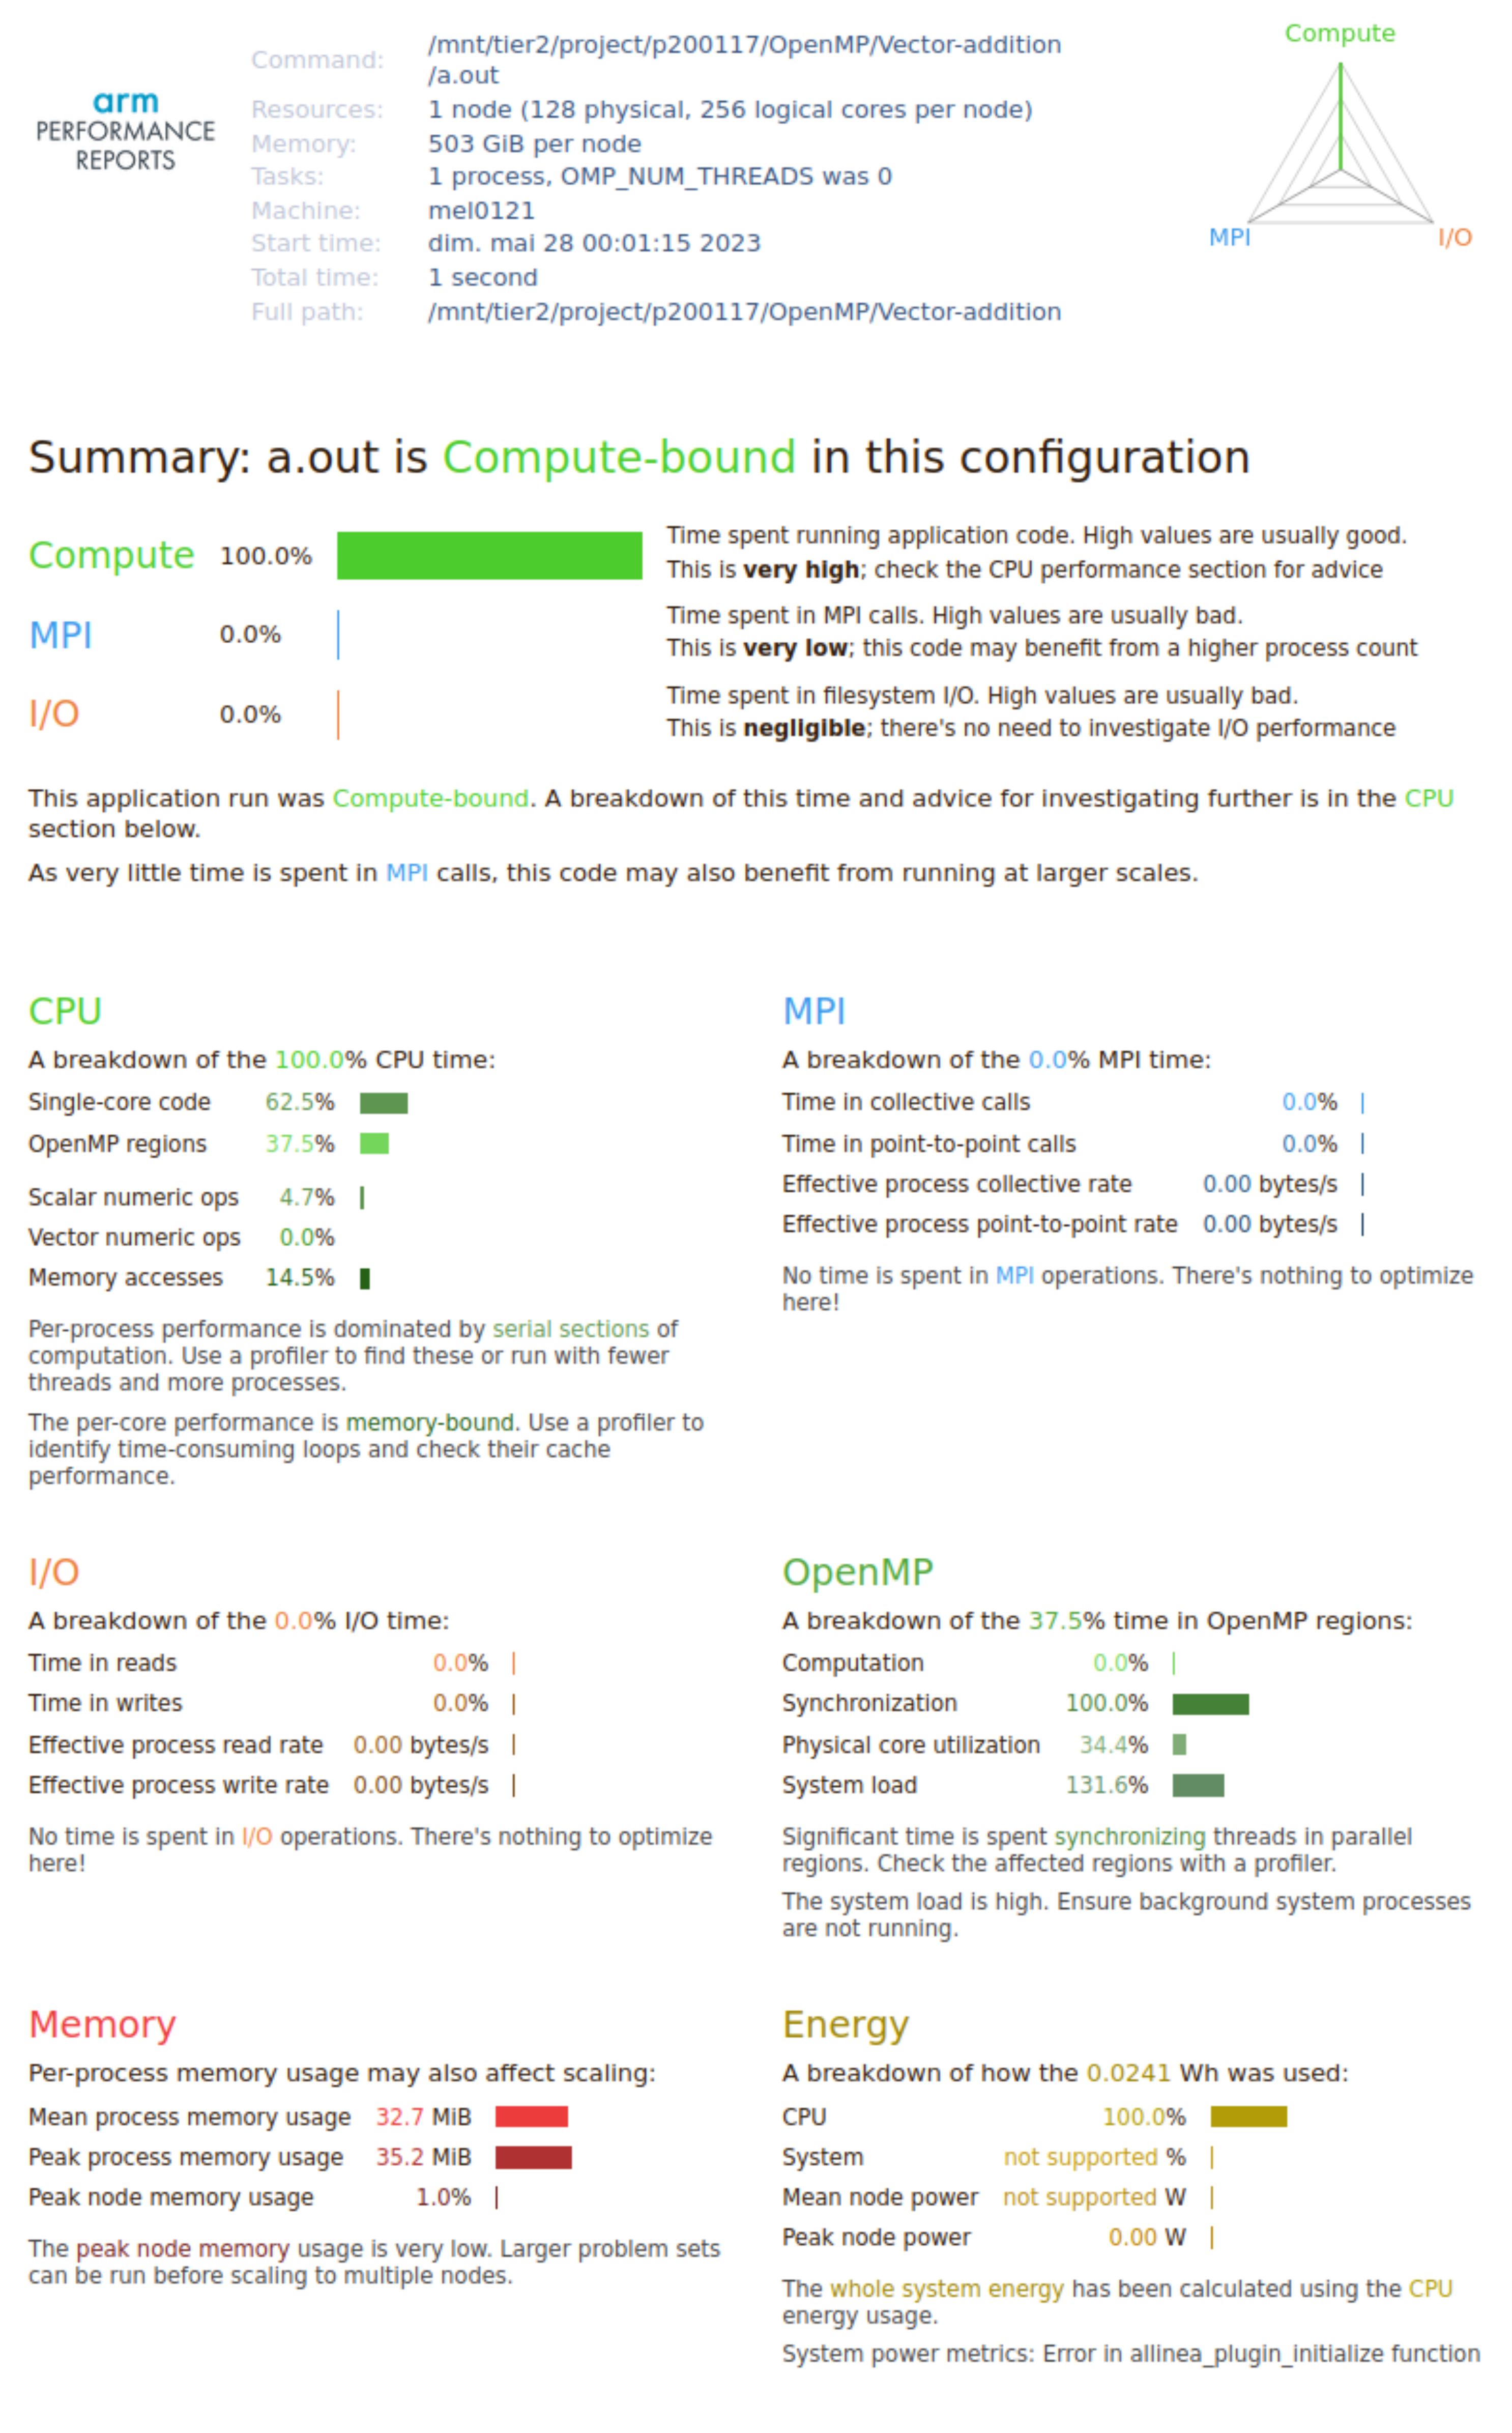
ARM Forge
Arm Forge is another standard commercial tool for debugging, profiling, and analysing scientific code on the massively parallel computer architecture. They have a separate toolset for each category with the common environment: DDT for debugging, MAP for profiling, and performance reports for analysis. It also supports the MPI, UPC, CUDA, and OpenMP programming models for different architectures with a variety of compilers. DDT and MAP will launch the GUI, where we can interactively debug and profile the code. Meanwhile, perf-report will provide the analysis results in .html and .txt files.
Example: ARM Forge
Intel tools
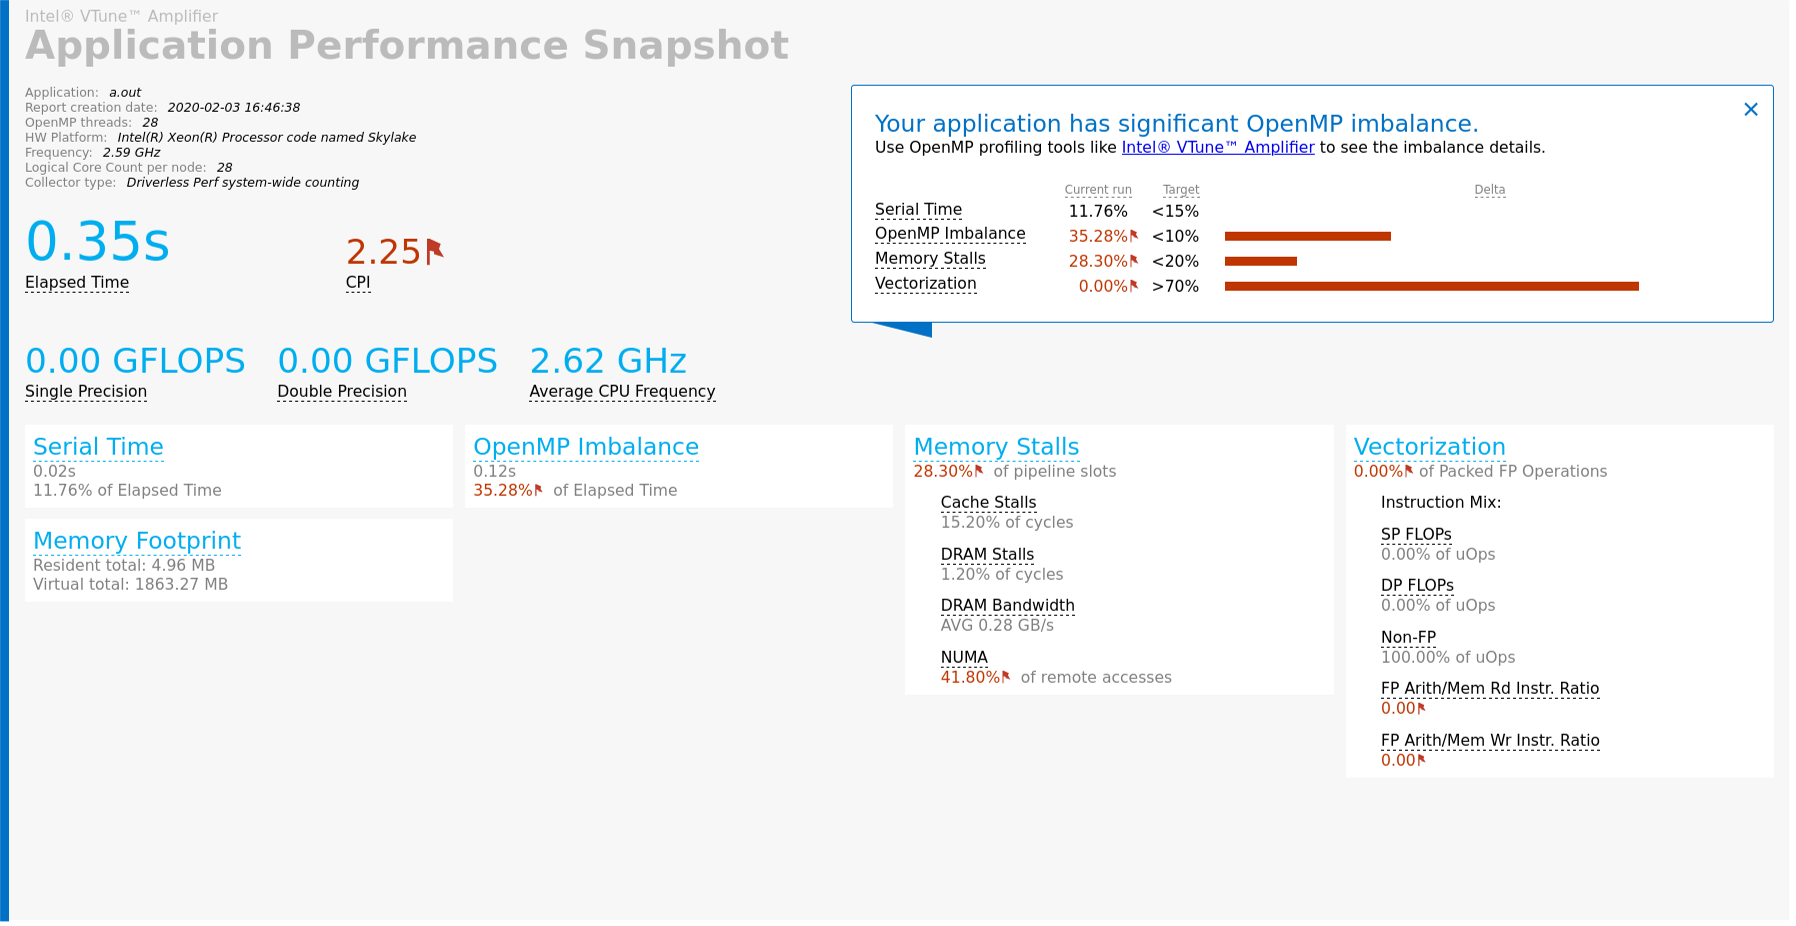
Intel Application Snapshot
Intel Application Performance Snapshot tool helps to find essential performance factors and the metrics of CPU utilisation, memory access efficiency, and vectorisation. aps -help will list out profiling metrics options in APS
Example: APS
Intel Inspector
Intel Inspector detects and locates the memory, deadlocks, and data races in the code. For example, memory access and memory leaks can be found.
Example: Intel Inspector
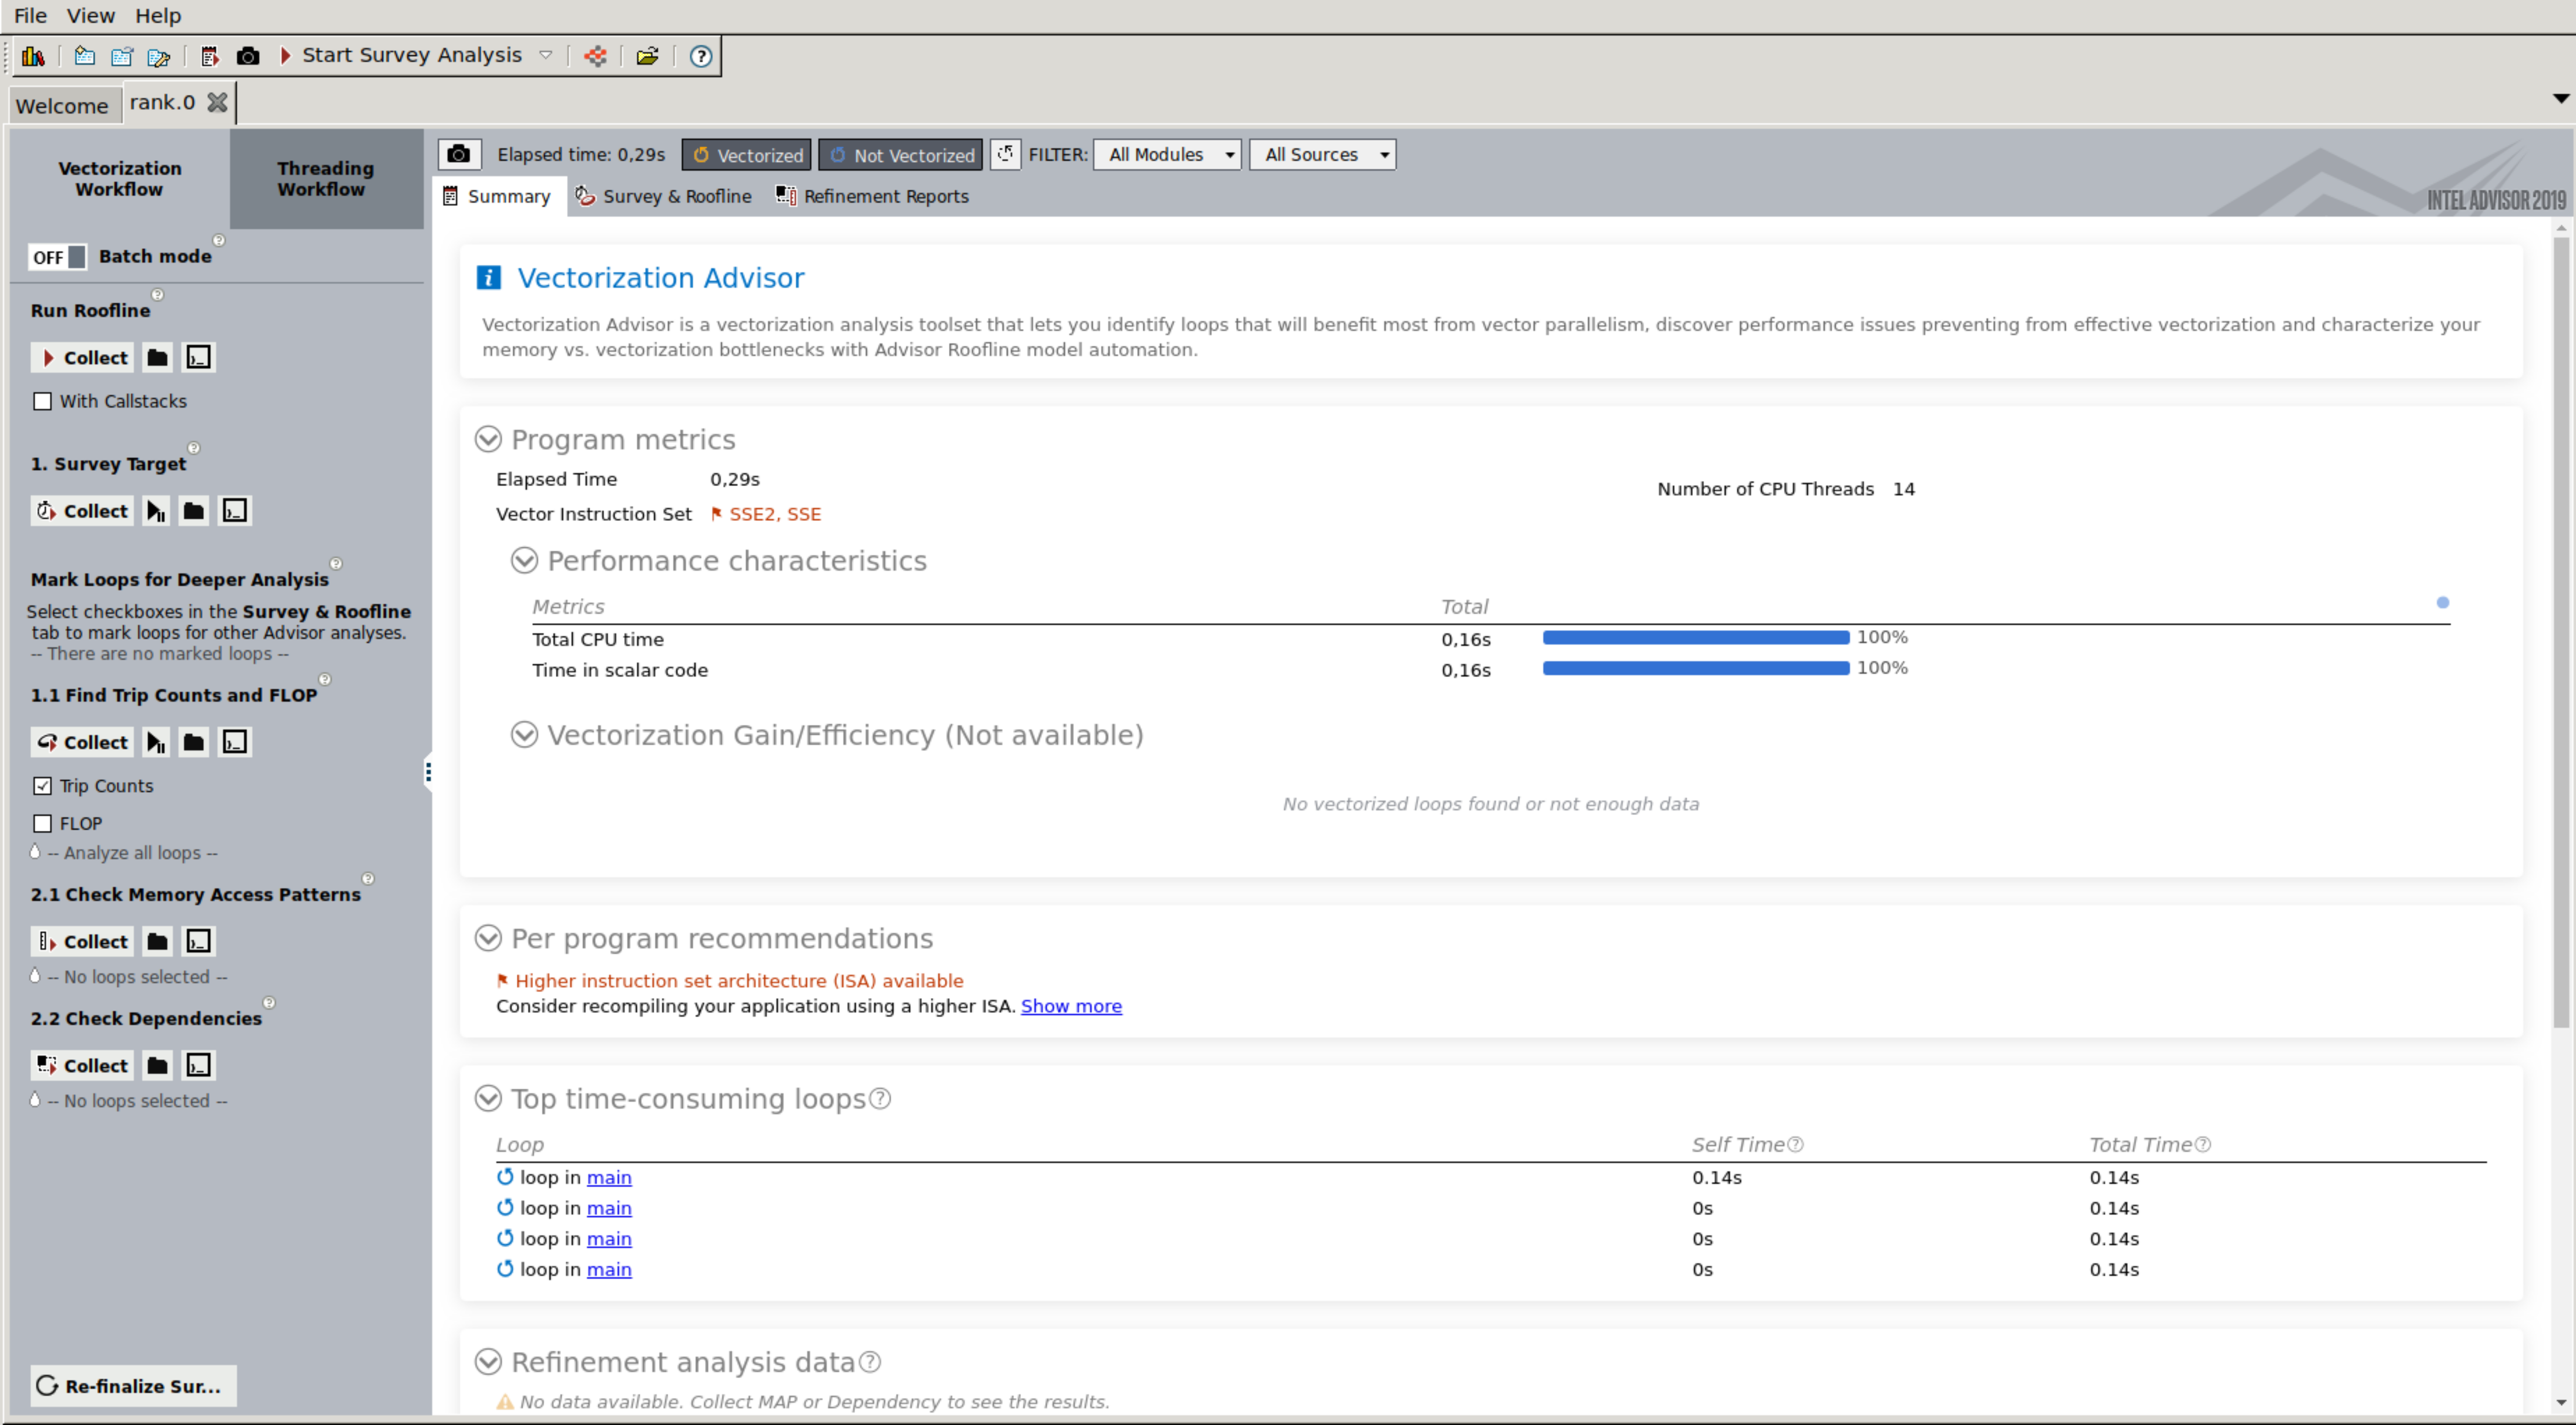
Intel Advisor
Intel Advisor: a set of collection tools for the metrics and traces that can be used for further tuning in the code. survey: analyse and explore an idea about where to add efficient vectorisation.
Example: Intel Advisor
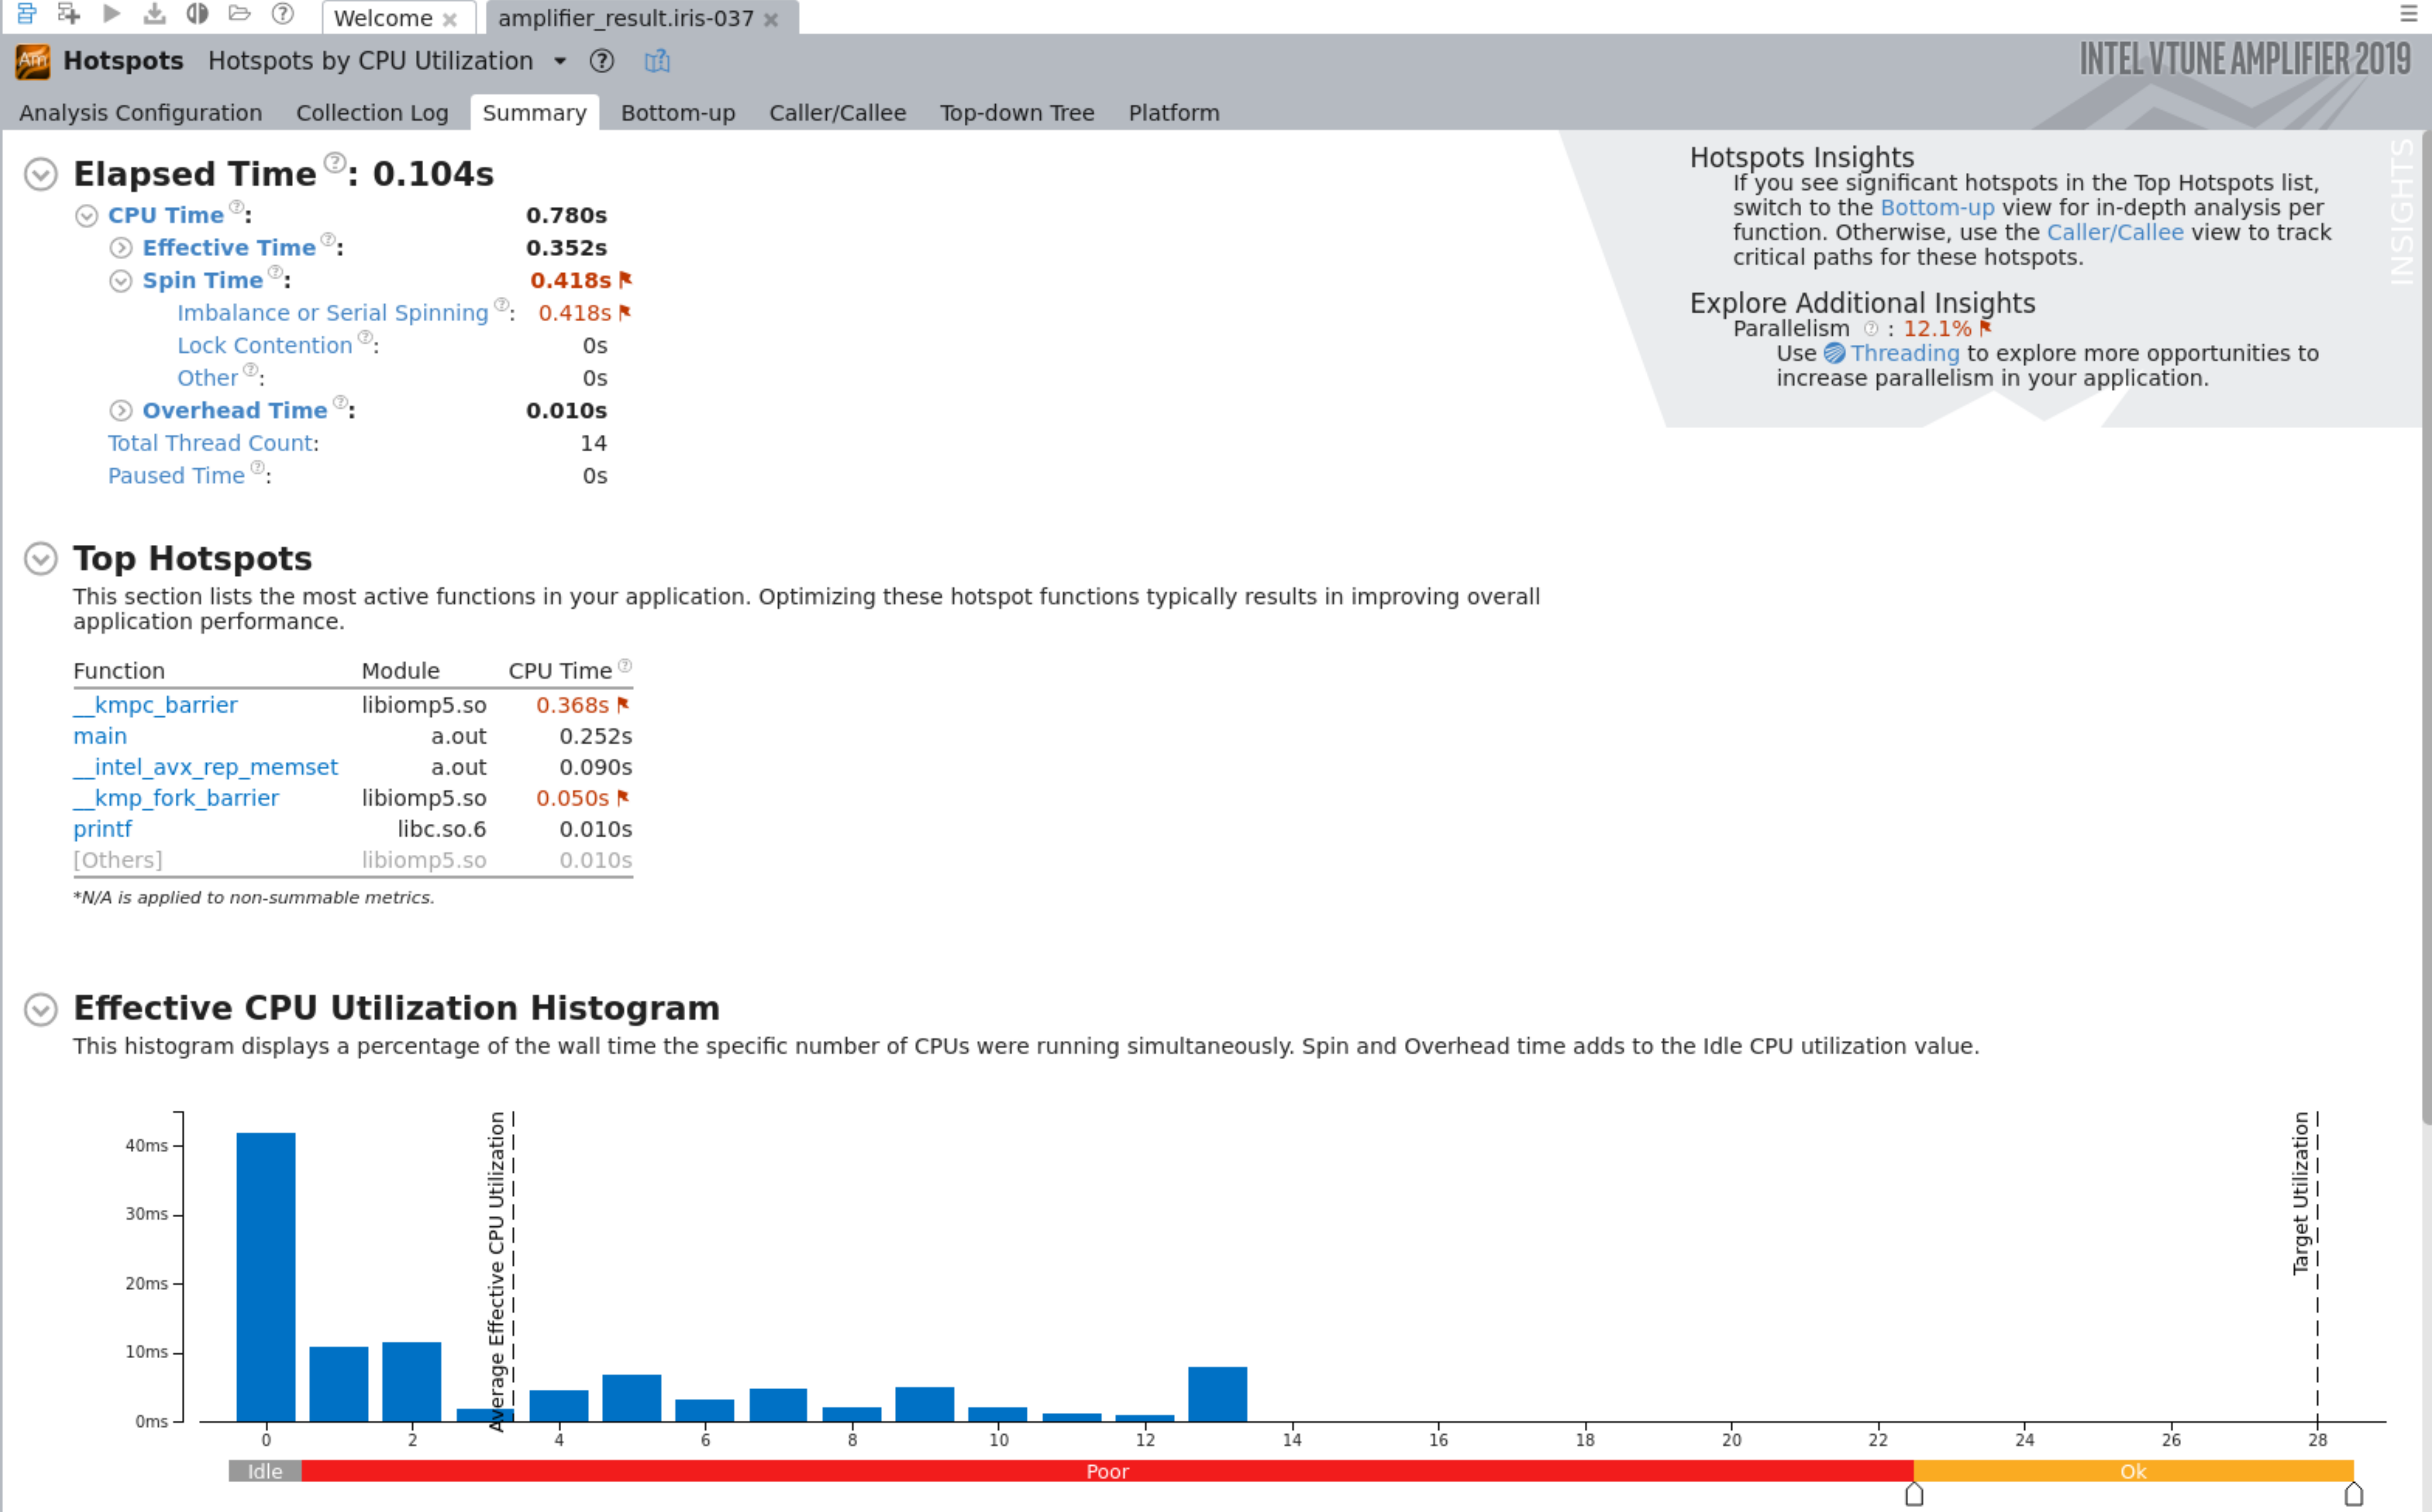
Intel VTune
- Identify the time-consuming part of the code.
- Also, identify cache misses and latency.
Example: Intel VTune
amplxe-cl will list out the analysis types and amplxe-cl -hlep report will list out available reports in VTune.
AMD uProf
AMD uProf profiler follows a statistical sampling-based approach to collect profile data to identify the performance bottlenecks in the application.
Example: AMD uProf
Created: April 26, 2023 10:45:49